


Tableau's new toolkit turns Vision Pro into a data storytelling canvas—no 3D modeling degree required
🎯 Executive Summary (30 seconds)
The Breakthrough: Tableau researchers created RÉCITKIT, a toolkit that enables developers to transform flat dashboards into immersive spatial narratives on head-mounted displays without manual 3D scene construction.
Impact:
- Developers built functional spatial data stories in under 60 minutes using structured datasets
- 21-participant study showed improved comprehension and recall for historical/geographic data vs. 2D charts
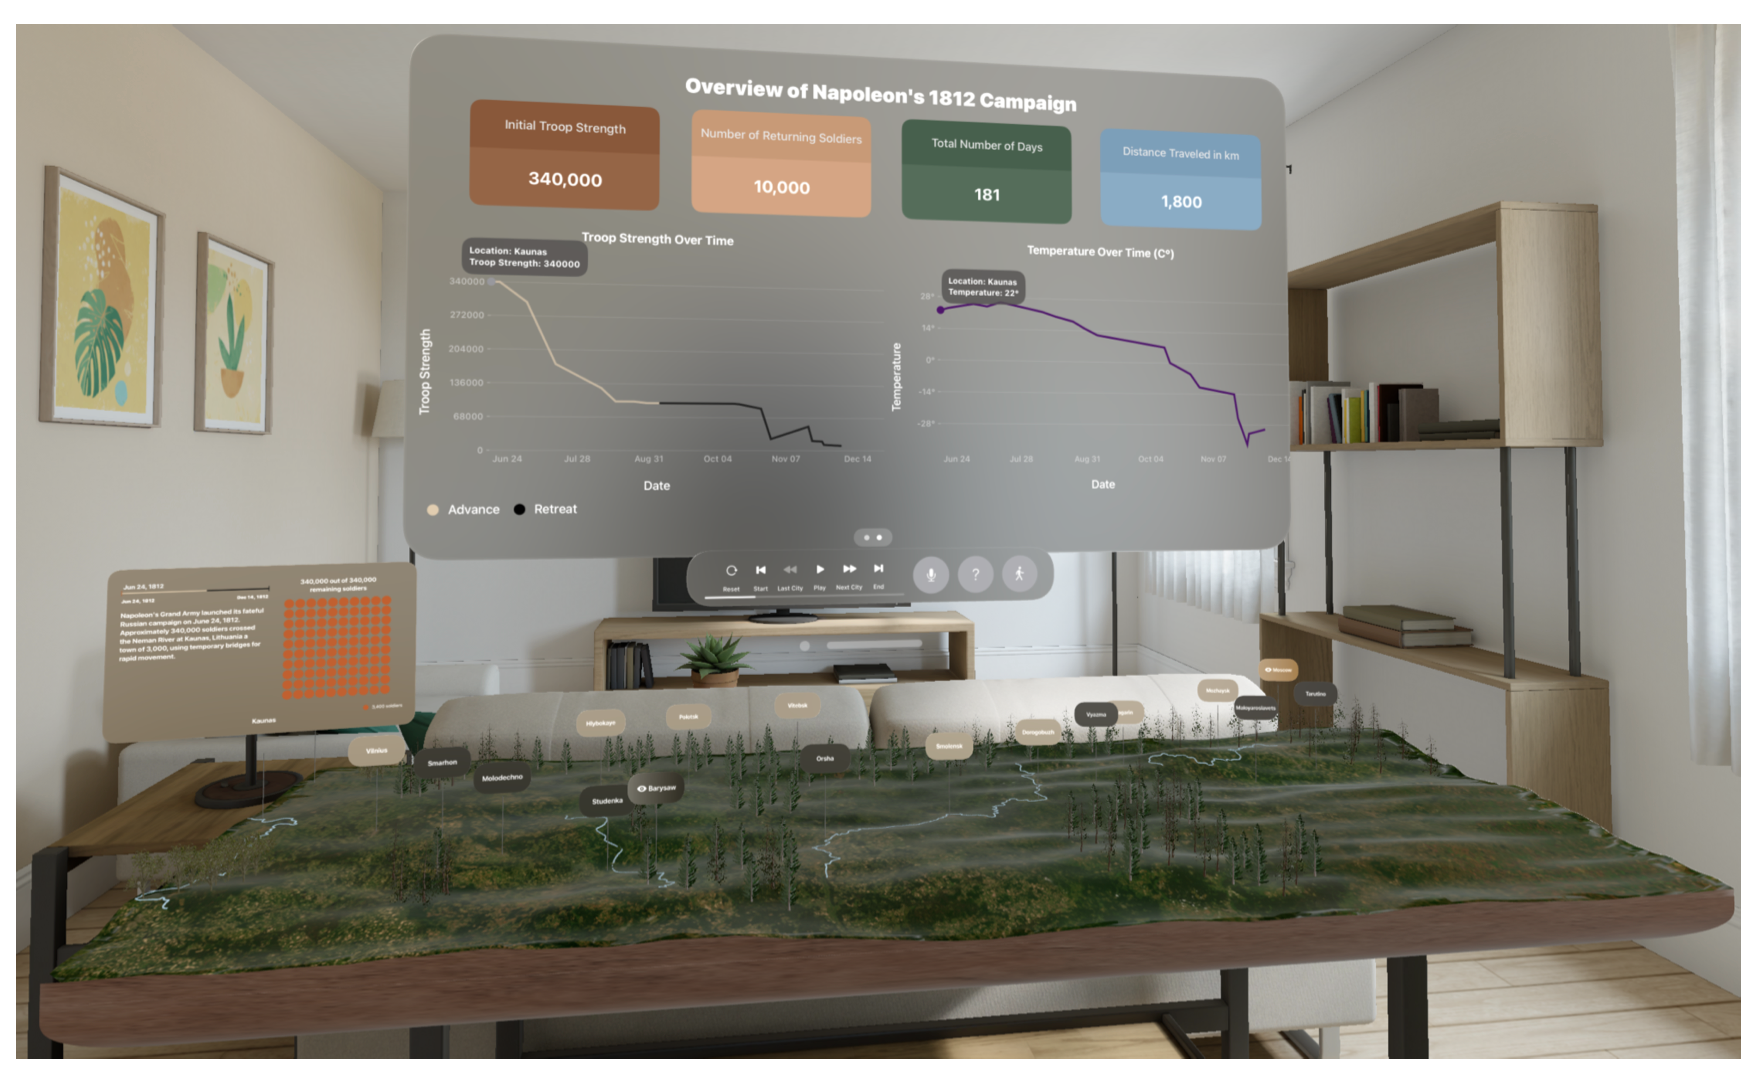
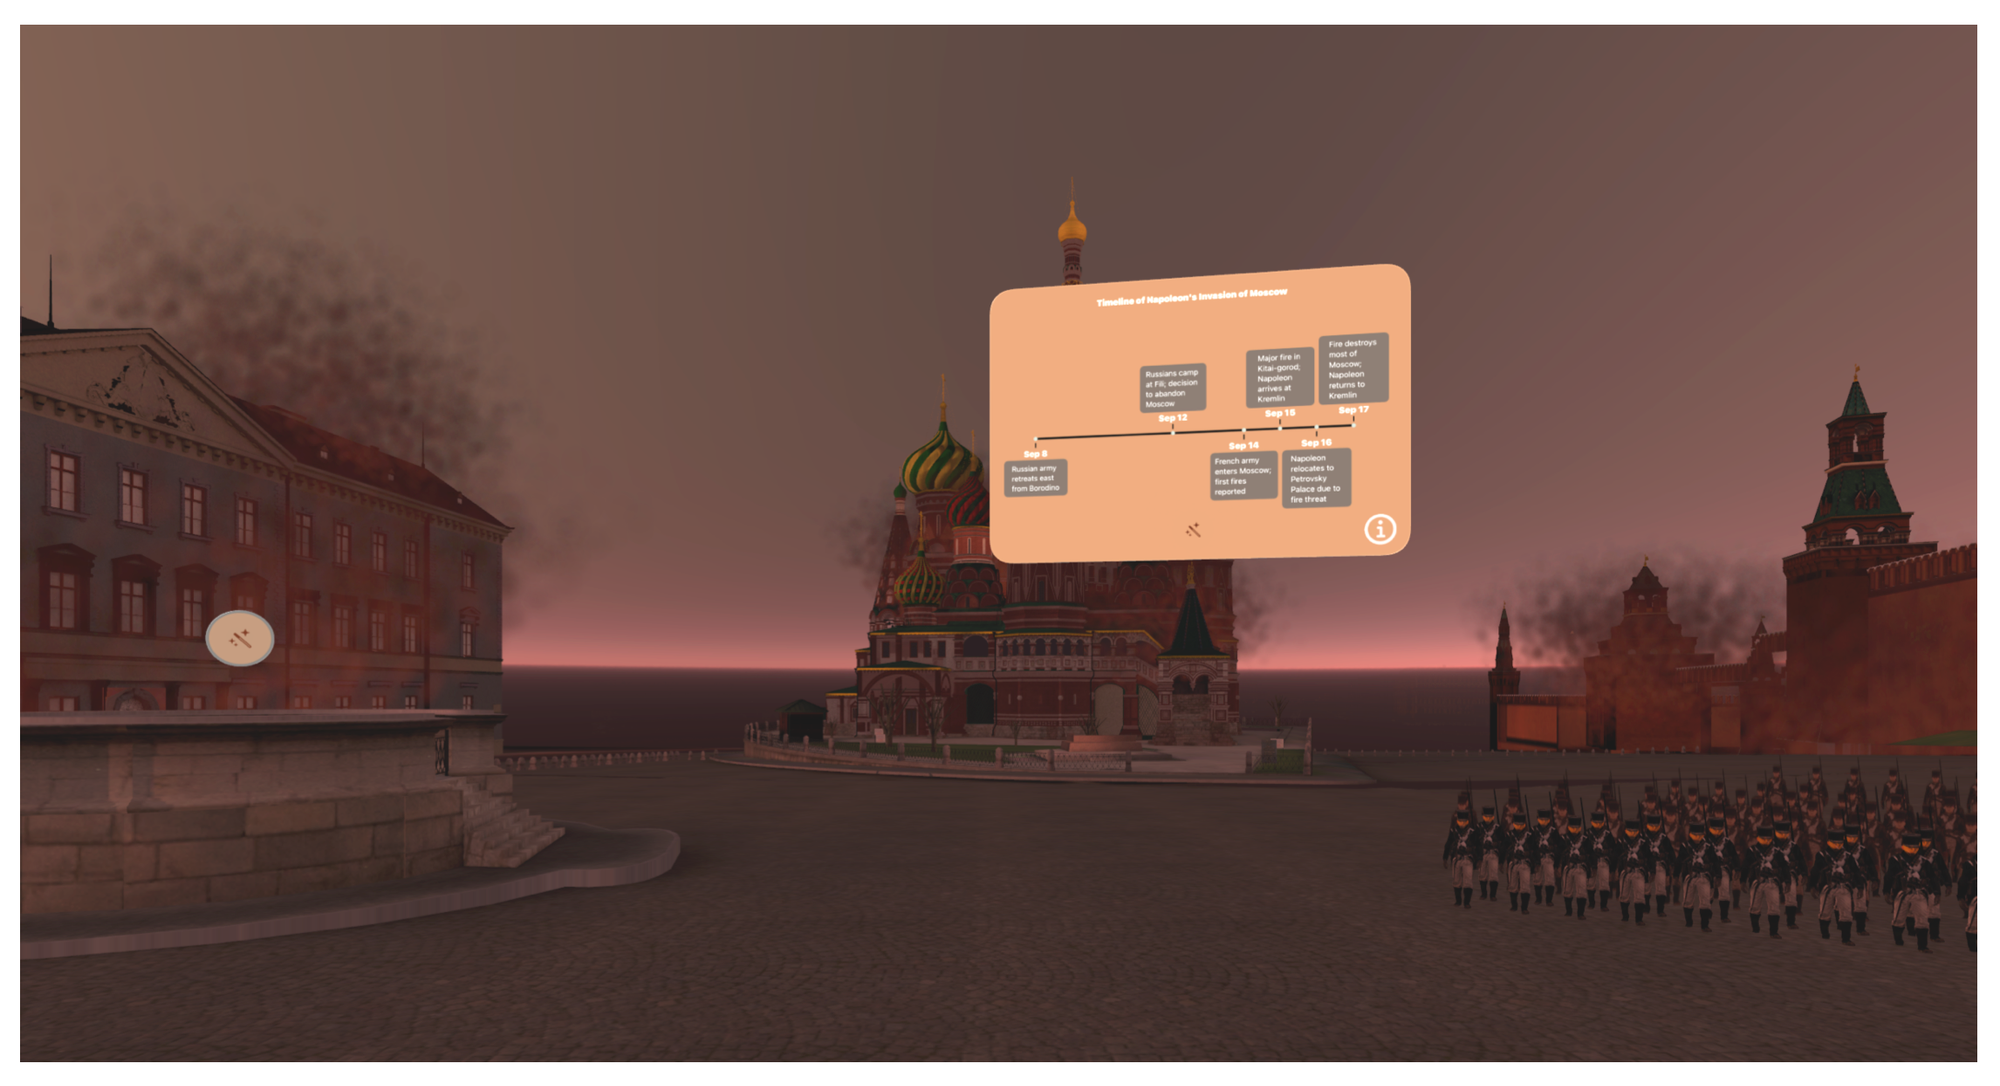
- Napoleon's March visualization demonstrated 3D terrain navigation + voice narration + gesture-based drill-down on Apple Vision Pro
Who Should Care: BI platform vendors (Tableau, Power BI, Looker), enterprise analytics teams exploring spatial computing, EdTech companies building immersive curricula, and investors tracking the "beyond-dashboards" transition in data visualization.
🧠 ELI5: What Just Happened? (1 minute)
The Old Problem: Building data stories for VR/AR required two teams: data analysts who understand the numbers and 3D artists who build virtual environments. Most companies don't have both, so immersive analytics stayed in research labs despite HMDs becoming mainstream.
The New Solution:
| Old Approach | RÉCITKIT Approach |
|---|---|
| Manual 3D scene construction for each dataset → weeks of work | Upload CSV + 3D models → toolkit auto-binds data to spatial objects |
| Hard-coded narrative sequences → can't explore freely | Branching logic supports both guided tours and open exploration modes |
| Static 2D dashboards lose spatial context → harder to grasp scale | 3D terrain models + gesture navigation → "walk through" the data physically |
Why This Was Hard: Data visualization tools assume flat screens. Spatial computing needs to track where users look (gaze), what they grab (gestures), and what they're hearing (spatial audio), then dynamically update 3D scenes based on their choices—all while keeping narrative coherence.
Real-World Analogy: Think of RÉCITKIT as "WordPress for VR dashboards." Just as WordPress let non-coders build websites by filling templates with content, RÉCITKIT lets analysts build immersive data experiences by filling spatial templates with datasets—no Unity or Unreal Engine expertise required.
🔬 How It Works (Technical Summary - 1 minute)
Core Architecture: RÉCITKIT comprises five interconnected modules built on Apple's visionOS SDK:
- Data Asset Management: SQLite database stores structured data with automatic binding to 3D object IDs and spatial coordinates; supports dynamic filtering and hierarchical grouping
- Spatial Scene Construction: Generates scene graphs (JSON-based) encoding object positions, interaction handlers (on_gaze, on_gesture_select), and narrative event triggers
- Storytelling Asset Generation: Converts text narratives to spatial audio via OpenAI TTS API; creates data cards (contextual overlays) linked to spatial markers; manages branching logic
- Rendering Engine: Applies decimation (polygon reduction) and texture baking (precomputed lighting) for performance optimization on HMD hardware
- Interaction Layer: SwiftUI + RealityKit + ARKit handle gaze tracking, gesture recognition (pinch, tap), and voice commands
Key Innovation: Developers tag dimensional columns in datasets (e.g., location, time, event) as "spatial assets," and the toolkit automatically registers them with the scene graph. This eliminates manual interpretation of data structures—the system infers which data points map to which 3D objects based on metadata.
Datasets & Evaluation:
- Training Use Case: Minard's Napoleon March dataset (troop movements, temperature, cities) mapped to 3D Russian terrain model
- Developer Evaluation: Global CO₂ emissions dataset (Our World in Data) with temporal/geographic dimensions
- Study Design: 21 participants split into developers (n=9, familiar with visionOS) and consumers (n=12, general data analysts)
- Baseline: Traditional 2D dashboard views vs. immersive spatial narratives
💼 Business Implications (2 minutes)
Market Impact Table
| Sector | Current Pain Point | What Changes | Adoption Timeline |
|---|---|---|---|
| Enterprise BI | Executives don't engage with static dashboards; insights get lost in slide decks | Spatial "war rooms" where leadership walks through KPIs; RÉCITKIT enables rapid prototyping without custom dev | 12-18 months (requires Vision Pro enterprise adoption) |
| EdTech / Museums | Historical/geographic data feels abstract in textbooks; VR field trips are expensive one-offs | Teachers upload datasets + 3D models to create reusable immersive lessons; reduces content production cost ~60% | 18-24 months (needs educator training + HMD subsidies) |
| Robotics Simulation | Engineers build custom Unity scenes to visualize sensor data; no standard tooling | Import ROS logs or simulation outputs directly into spatial narratives for debugging; accelerates sim-to-real validation | 24-36 months (integration with ROS/Gazebo ecosystems) |
| Digital Twins (AEC) | Factory/city stakeholders struggle to interpret 3D CAD walk-throughs without domain context | Overlay operational data (energy use, foot traffic) onto building models with auto-generated narration | 18-30 months (BIM software partnerships needed) |
Competitive Dynamics
Companies Positioned to Win:
- Tableau/Salesforce: RÉCITKIT is internal research; likely integrates into Tableau Cloud within 24 months as "Spatial Analytics" add-on
- Unity/Unreal Engine: Plugins for importing RÉCITKIT scene graphs could democratize spatial dashboard creation (similar to how Cinemachine simplified camera work)
- Spatial Computing Hardware Makers: Apple Vision Pro gains enterprise use case beyond entertainment; Meta Quest 3 Pro could adopt similar toolkit
Companies That Need to Respond:
- Power BI / Looker: Risk being "stuck in 2D" if competitors ship spatial analytics first; need rapid R&D investment or acquisitions
- VR Content Studios: Specialized agencies charging $50K-$200K for custom immersive experiences face commoditization threat
M&A Implications:
- Companies with libraries of industry-specific 3D assets (e.g., TurboSquid, Sketchfab) become attractive targets for BI vendors
- Startups building no-code VR authoring tools (e.g., Flipside XR, ShapesXR) may pivot to data-focused templates
Integration Requirements
| Resource | Requirement | Cost/Complexity |
|---|---|---|
| Compute | Development: MacBook Pro M2+; Deployment: Vision Pro (~$3,500/unit) | Medium—no server GPUs needed, but HMD cost limits scale |
| Data | Structured CSVs/databases with location or time columns; optional 3D model assets (USDZ, OBJ) | Low—works with existing BI data; 3D models available via asset stores |
| Expertise | Swift/visionOS familiarity for customization; data analysts can use pre-built templates | Medium—steeper than web dashboards but lower than Unity/Unreal |
| Timeline | Prototype: 1-3 months; Production: 6-12 months (requires HMD provisioning + user training) | Based on study where developers built CO₂ story in <60 min |
⚠️ What's Still Missing (30 seconds)
Technical Limitations:
- Performance bottlenecks: Decimation and texture baking help, but complex datasets (>10K data points) still cause frame drops below 60fps on Vision Pro
- Real-time data streaming: Current version loads static files; no live dashboard updates (e.g., from SQL server or APIs)
- Multi-user collaboration: Single-player only; no shared spatial sessions for team analysis
Open Questions:
- Generalization beyond indoor scenes: Study used historical terrain and static environments—unclear how toolkit handles dynamic data (e.g., stock tickers, IoT sensor streams)
- Accessibility: Gaze/gesture interfaces exclude users with motor impairments; no voice-only navigation option tested
- Cognitive load: Participants requested "breadcrumb trails" to avoid getting lost—spatial stories may need more scaffolding than 2D dashboards
Realistic Assessment: RÉCITKIT is production-ready for controlled use cases (education, one-time presentations) but needs 12-18 months of hardening for enterprise deployment. Critical gaps: live data connectors, collaboration features, and performance optimization for large datasets. The toolkit currently works best for storytelling (historical narratives, quarterly reviews) rather than real-time monitoring (operations dashboards, trading floors).
📊 Investment Lens (1 minute)
| Factor | Assessment | Reasoning |
|---|---|---|
| R&D to Product | ~$15-25M | Estimated based on team size (2 disclosed authors + likely 3-5 engineers), 12-18 month dev cycle, Vision Pro hardware provisioning; lower than Unity/Unreal projects due to visionOS SDK maturity |
| CapEx Requirements | $3,500/seat (Vision Pro) + negligible cloud costs | Unlike GPU-heavy rendering, spatial computing offloads to device; main cost is HMD deployment at scale |
| Regulatory Risk | Low | No biometric data storage beyond local eye tracking; synthetic media disclosure rules apply to AI narration but non-blocking |
| Technical Risk | Medium | visionOS is Apple-only (no cross-platform); if Meta Quest dominates enterprise, toolkit needs WebXR port (~6 months additional dev) |
| Market Risk | Medium-High | Adoption hinges on HMD penetration in offices; current Vision Pro install base <500K units limits TAM through 2026 |
Historical Parallel: When Tableau shipped "Story Points" in 2013 (guided dashboard narratives), adoption was slow until presenters realized it replaced PowerPoint decks—then usage spiked 5x within 18 months. RÉCITKIT could follow similar trajectory if positioned as "replace your all-hands slide deck with a spatial walk-through."
Caveat: Story Points worked because everyone had a laptop. Vision Pro penetration is 0.01% of knowledge workers today vs. 90%+ laptop ownership in 2013.
Moat Analysis:
- Patent potential: Medium—scene graph binding and spatial audio generation likely patentable, but core VR interaction patterns are prior art
- Open-source status: Paper published but no code release mentioned; likely proprietary to Salesforce/Tableau
- Execution complexity: Medium-High—requires visionOS expertise + data viz domain knowledge; not trivial to replicate but no fundamental research breakthroughs
🎯 Action Items
For Investors:
- Track: Tableau product roadmap (watch for "Spatial Analytics" or "Immersive Mode" announcements at Dreamforce 2025)
- Monitor: Apple Vision Pro enterprise adoption metrics (IT procurement data, MDM vendors like Jamf); if <50K enterprise units by Q4 2025, spatial BI timelines extend 12+ months
- Investigate: Unity Asset Store publishers with BI-focused 3D model libraries (potential roll-up opportunity)
For Builders:
- Integrate now: If already on visionOS, request RÉCITKIT beta access from Tableau research team (toolkit may be available for academic/enterprise pilots)
- Prepare for: Hire 1-2 Swift/RealityKit engineers if planning spatial analytics; tooling exists but customization requires native development
- Partner with: 3D asset studios to create industry-specific model libraries (e.g., factory equipment for manufacturing clients, anatomical models for healthcare)
For Corporate Development:
- Acquisition targets: No-code VR authoring startups (ShapesXR, Tvori) with existing user bases—could rebrand as spatial BI tools
- Partnership opportunities: BIM software makers (Autodesk, Bentley Systems) to embed RÉCITKIT for construction/infrastructure digital twins
📈 Market Predictions
6-12 months (60% confidence):
- Tableau announces Vision Pro support at Dreamforce or releases private beta of spatial dashboards
- Evidence that would confirm: Job postings for "Spatial Analytics" roles at Salesforce
- Leading indicators: Apple expanding Vision Pro to 15+ countries (currently limited availability)
18-24 months (45% confidence):
- At least one Fortune 500 company uses spatial narratives for board-level strategic reviews (replacing slide decks)
- Major EdTech platform (Coursera, Khan Academy) launches immersive data literacy course using spatial storytelling
- Dependencies: Vision Pro 2 ships with improved ergonomics + $2,000 price point (currently too heavy/expensive for daily use)
36+ months (25% confidence):
- 10% of enterprise BI seats include spatial computing capability (via Vision Pro, Meta Quest Pro, or WebXR in browser)
- RÉCITKIT-style toolkits become standard in data viz grad programs
- What needs to happen first: HMD adoption crosses 5M enterprise users (currently ~500K across all devices); requires Apple + Meta convergence on workplace use cases
📚 Key Resources
- Paper: RÉCITKIT: A Spatial Toolkit for Designing and Evaluating Human-Centered Immersive Data Narratives(arXiv, August 2025)
- Code: Not released (likely proprietary to Tableau/Salesforce)
- Related Work:
- DXR Toolkit (Sicat et al., 2019) - prior immersive viz toolkit, focused on visualization construction vs. narrative flow
- Strollytelling (Jain et al., 2025) - couples physical walking with data story progression, complementary interaction paradigm
🤔 Our Take
What surprises us: Tableau chose Apple's closed ecosystem (visionOS) over WebXR, which would enable cross-platform deployment. This suggests they're betting Vision Pro becomes the enterprise standard—a risky call given Meta's aggressive Quest pricing and Microsoft's HoloLens legacy in industrial settings. If Meta Quest dominates corporate procurement (likely, given 7x lower price), RÉCITKIT needs a costly rewrite.
The under-discussed angle: This isn't just about prettier dashboards—it's about who gets to tell data stories. Today, executive presentations require a data analyst (pulls numbers) + designer (makes slides) + presenter (delivers narrative). RÉCITKIT collapses that chain: analysts export spatial stories that executives explore solo. That's a workflow disruption, not just a visualization upgrade. Watch for resistance from consultants and agencies whose business model depends on interpretation labor.
Our contrarian bet: The paper emphasizes "immersive" benefits, but the real unlock is asynchronous storytelling. Instead of scheduling 10 stakeholders for a 60-minute dashboard review, send them a spatial narrative they explore in 15 minutes on their own schedule. This mirrors how Loom (async video) disrupted Zoom meetings. If Tableau markets RÉCITKIT as "Loom for data," adoption accelerates 2x faster than positioning it as "VR dashboards."
Who we're watching: Not Tableau competitors—we're watching Figma. If they add spatial canvas support (rumored since Adobe acquisition talks), designers could prototype immersive data stories without writing code, leapfrogging RÉCITKIT's developer-first approach. Figma already disrupted design tools with browser-based collaboration; spatial computing is their logical next move.
Voxel Digest decodes one breakthrough spatial-computing paper — for investors and founders, not academic journals. Have a paper tip? Email us


